Back in the good old day you required software to do this, and the one I used was called Fiddler which essentially would create a proxy server on your device, send all the data though that as a man in the middle attack and tell you what was going on.
Warning: Fiddler will create a "man in the middle" attack to be able to monitor traffic inside the HTTPS session, please remember that this is also what threat actors do as well, if you are in a "domain" remember as well that a "subordinate" certificate deployed by your sysadmin can FORCE your browser to trust a certificate that is not the valid certificate.
Information: The padlock in your browser does NOT mean your traffic is secure and you are talking to the "original" host, for that you need to check the HTTPS thumbprint, the padlock simply means you have a secure session, not a secure session with the original host server!
If you use Fiddler then you will need to trust the root certificate and for end to end testing that is more helpful to figure out the root cause, also remember that Fiddler can capture non-web traffic whereas a browser can only capture traffic for that session, this means Fiddler is not dead, its just got a different use case, there are now 2 version for this software Fiddler Classic which is a local application with local logging, and Fiddler Everywhere which capture traffic that can be viewed "in the cloud" and "cross platforms"
Fiddler also allows you to re-write and intercept headers and data as well, which the development tools does not allow you to do either, so based on your requirement you may still require Fiddler.
However these days all you require is a modern web browser and the F12 key, for developer options and it will do it right there from the browser, all hail megaton and the progress of technology, this guide will cover both.
Traffic : Browser Debugging
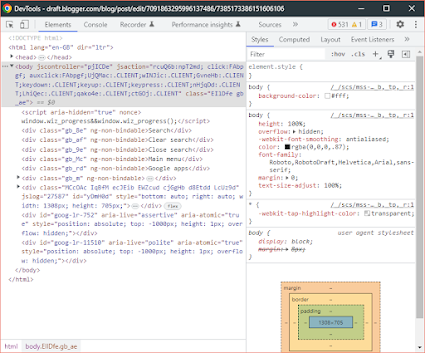
Lets start with the browser debugging as that one is easier, as its simply a press of F12, so when you press F12 you will end up on the "elements" page, this shows you the elements of the website you are currently looking at as you see below:

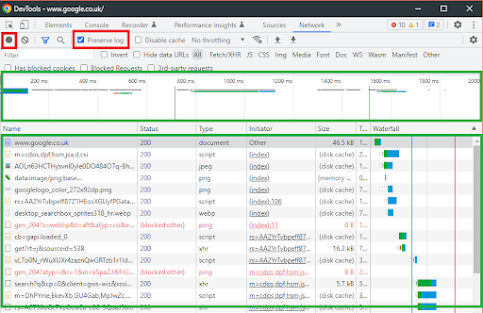
You need to select the network option:
This will then look like this, the first red box is the stop and start capture options, then the one called "preserve log" will ensure when you navigate though the website you will not loose the history, very helpful for many websites so ensure this is ticked....
Network : The Setup
Then you have the timeline on the top in green, and beneath that you have the "traffic" or "endpoints" you are visiting......

This is where the data can be seen and what is going on, however there are some items you need to know, first lets get some data to look at, so select the www.google.co.uk as shown below:
The default view is the response, which will be in HTML and that will be the Google search engine in the raw HTML to confirm this click the preview button and then you will see the HTML without images as they are in a different request in debugging:
 Developer Tools : Headers
However the most useful view is "headers" this will show you how the website as been loaded and look like this, here you can see the status code as well, a very helpful diagnostic tool in troubleshooting website issues
Raw Header Data
So for Google this is what we get, this is the raw data and it will be expanded later on in this guide......
Decoded:
message ClientVariations {
// Active client experiment variation IDs.
repeated int32 variation_id = [3300100, 3300133, 3300161, 3313321, 3322704, 3330198, 3347851, 3362669, 3362821, 3363133, 3363153, 3363359, 3363670, 3363676, 3364112, 3364132, 3364232, 3364280, 3364687];
// Active client experiment variation IDs that trigger server-side behavior.
repeated int32 trigger_variati
So what exactly does this tell us, well when the website works it tells you how the website works and what your browser sends and receives, so lets focus on the handy headers and dtop some that are not helpful right now......
Helpful Headers : Analyse
This is all the headers that teach you the basics of how the browser and the server work lets go though some now, for the basics......
This is they type of request you are asking for, here you can see we have a GET which means its "getting" content, for all the options please see the section below called "Request Method"
Request Method Lookup (Common Ones)GET
The GET method requests a representation of the specified resource. Requests using GET should only retrieve data.
HEAD
The HEAD method asks for a response identical to a GET request, but without the response body.
POST
The POST method submits an entity to the specified resource, often causing a change in state or side effects on the server.
CONNECT
The CONNECT method establishes a tunnel to the server identified by the target resource.
OPTIONS
The OPTIONS method describes the communication options for the target resource.
HTTP Codes (not all errors)
For a full list please use this has reference,
here but the ones you need to know for general troubleshooting are:
200 OK
301 Moved Permanently
302 Found
304 Not Modified
307 Temporary Redirect
308 Permanent Redirect
400 Bad Request
401 Unauthorized
403 Forbidden
404 Not Found
405 Method Not Allowed
500 Internal Server Error
502 Bad Gateway
503 Service Unavailable
504 Gateway Timeout
That outlines the basics of how to use the endpoint section, however, remember what is outlined above, is one request out of many, and so using Google as an example is not particularly helpful for debugging, because Google is very rarely not available.
I understanding the fundamentals of how stuff works when it works is the key to understanding why it’s not working when it doesn’t work, usually you will be delving into debugging when the website doesnt work
It is important to note that there are two sides to debugging website traffic, you have the local side, which in this instance is the client for example Chrome as a Browser, then you have the server side which could also be called the remote side, and for many websites, not loading it’s a front end problem, however, depending on your fault, it’s not always possible to get the remote side diagnostic data like in the case of Google, however, that does not mean you cannot troubleshoot the problem partially, and then, if required work with the third-party vendor to a resolution.
Full session trace - Google Trace
First of, let’s get an example of a full section trace, to this point we have been looking at a single web request, so let’s take the full session for Google, I am choosing Google because it’s a pretty simple website that is not going to flood our session traced with data, so it will end up being pretty simple to go through, obviously the more complicated the website the more sessions you’re going to need to analyze for potential problems, but it’s always best to start simple.
<more to come>


